All paths lead from logistics in LaSalle’s new Europe Paths of Distribution analysis
How will spiking diesel fuel prices change where logistics operators want to locate? LaSalle’s latest Paths of Distribution (PoDs) analysis gives us the analytical engine to answer this question – which has been made especially relevant in 2026 by the partial closure of the Strait of Hormuz.

By Daniel Mahoney, Europe Head of Strategy and Research, LaSalle Investment Management
The answer depends on triangulating across factors – labour availability, relative transport costs per euro of sales, drive-time catchment – and at a highly granular scale: we’ve scored 146,073 micro-locations across Europe. The results show that, in a 50% diesel fuel price spike, France and UK logistics are relatively insulated because fuel is a lower component of costs in both countries.
Even more importantly, locations that are more central fare better. This is quite a general statement by itself – but PoDs takes us from this broad pattern and gets us to much more specific insights that differ across locations. Consider for example, the comparison between two locations in Munich: one a micro-market 20 kilometres northwest of the city centre in Bergkirchen and another a micro-market 28km east of the city centre in Ebersberg.
The PoDs engine estimates that a distributor’s average transport costs are 9% lower in Bergkirchen. It is helped by being along Autobahn 8 and is on the pathway of many distribution networks heading northwest as well as south. When diesel prices rise, the transport cost difference between Bergkirchen and Ebersberg increases. The upshot of that widening differential is that occupiers could afford higher rent at the superior location. In fact, we estimate that a 50% diesel fuel price shock would be likely to widen the logistics rent differential between these two sites by 5%.
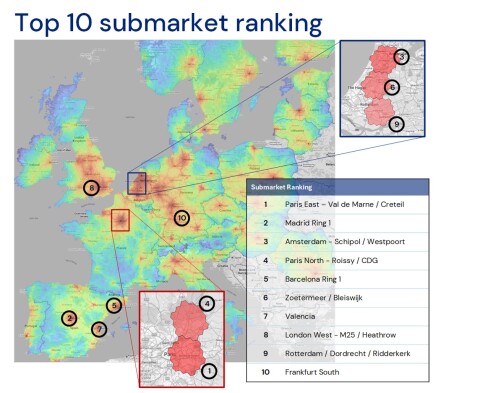
Our analysis can answer other questions too – we rank locations based on where demand is deepest for entire city regions, as well as for submarkets, and for individual micro-markets. In this edition, the top micro-market in all of Europe is just east of Paris in Val-de-Marne. But for aggregate city regions, it’s Rotterdam and London that tie for our top spot. In the map below we show a ranking of submarkets – an intermediate scale between the micro and regional levels.
Source: LaSalle Investment Management
Another question we address for the first time in the 2026 edition is how industrial stock – square metres of existing logistics space – compares to demand. We measured stock directly by training a neural network to classify 163,313 aerial images that aligned with sizeable building footprints in the UK, Germany, France, Netherlands, and Poland. The correlation between supply and demand is generally high – 0.88 in the Netherlands for instance – highlighting how developers and investors are very much seeking to match supply and demand.
Yet mismatches are also common – and it is these micro-market mismatches where supply and demand diverge that jump out for investment opportunity. Since 2024, LaSalle has used the Paths of Distribution to screen more than 2,000 industrial locations for potential investment. Read our full Paths of Distribution report at lasalle.com/insights.
Subscribe now and stay informed
Joining the CRE Media Europe mailing list is quick and simple. Just provide your contact details below to be added to our distribution list and start receiving the latest news, magazines and special updates, all free of charge.
Commercial real estate (CRE) Media Europe is a free to access news and information service providing dependable, independent journalism. Our mission is to provide the pan-European real estate market with the latest trends and data points, and provide key analytical coverage to help you make better decisions in your business.
To discuss advertising and commercial partnership opportunities please contact eddie@cremediaeurope.com